
Page 19 - City of Moreno Valley Invstment and Cash Management Program
P. 19
2a. TRENDS
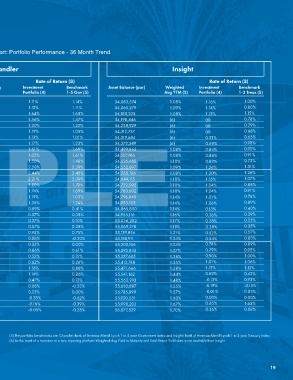
Sample trend excerpt from the Treasurer’s Cash and Investments Report: Portfolio Performance - 36 Month Trend.
LAIF Chandler Insight
Total General
Portfolio (1)
Local Agency Investment Fund Rate of Return (3) Rate of Return (3)
Period Asset Balance (par) Balance Yield Asset Balance (par) Weighted Avg Investment Benchmark Asset Balance (par) Weighted Investment Benchmark
YTM (2) Portfolio (4) 1-5 Gov (5) Avg YTM (2) Portfolio (4) 1-3 Treas (5)
Jul-15 161,937,644 24,936,318 0.320% 81,941,821 1.38% 1.11% 1.14% 54,083,574 1.08% 1.16% 1.00%
Aug-15 156,052,639 18,526,318 0.330% 82,043,091 1.39% 1.12% 1.11% 54,065,279 1.09% 1.14% 0.80%
Sep-15 157,437,337 17,626,318 0.337% 82,154,547 1.41% 1.64% 1.65% 54,180,338 1.08% 1.13% 1.15%
Oct-15 155,196,031 17,843,566 0.357% 82,223,743 1.41% 1.56% 1.47% 54,198,446 (6) (6) 0.78%
Nov-15 156,098,310 17,593,566 0.374% 82,355,838 1.42% 1.30% 1.22% 54,238,929 (6) (6) 0.39%
Dec-15 156,285,206 16,633,566 0.400% 82,433,426 1.43% 1.19% 1.05% 54,312,737 (6) (6) 0.68%
Jan-16 168,824,464 30,850,627 0.446% 82,510,170 1.43% 1.13% 1.01% 54,319,684 (6) 0.51% 0.65%
Feb-16 175,430,692 37,750,627 0.467% 82,617,177 1.44% 1.17% 1.23% 54,372,589 (6) 0.59% 0.98%
Mar-16 173,065,238 34,310,627 0.506% 82,721,056 1.46% 1.61% 1.69% 54,499,863 1.08% 0.84% 0.92%
Apr-16 169,665,429 32,296,705 0.525% 82,769,869 1.47% 1.62% 1.61% 54,517,986 1.08% 0.88% 0.91%
May-16 186,737,459 40,246,705 0.552% 82,923,233 1.49% 1.50% 1.48% 54,535,685 1.10% 0.82% 0.73%
1.49%
82,995,248
39,271,705
0.576%
Jun-16 179,533,412 SAMPLE 1.09% 1.26% 1.31%
2.39%
2.58%
54,552,897
Jul-16 173,464,003 35,222,341 0.588% 83,081,551 1.48% 2.44% 2.42% 54,560,166 1.08% 1.20% 1.26%
Aug-16 170,506,021 31,792,341 0.614% 83,224,209 1.50% 2.21% 2.09% 54,644,115 1.10% 1.15% 1.07%
Sep-16 176,898,187 37,892,341 0.634% 83,379,424 1.49% 1.80% 1.70% 54,722,092 1.10% 1.24% 0.88%
Oct-16 171,480,180 33,193,311 0.654% 83,523,267 1.49% 1.74% 1.69% 54,763,602 1.10% 1.24% 0.91%
Nov-16 169,062,818 29,923,311 0.678% 83,701,960 1.47% 1.19% 1.03% 54,796,940 1.14% 1.01% 0.76%
Dec-16 171,351,017 30,054,201 0.719% 83,828,755 1.52% 1.35% 1.24% 54,953,105 1.14% 1.06% 0.89%
Jan-17 178,020,726 37,628,655 0.751% 83,921,074 1.56% 0.59% 0.41% 54,865,800 1.14% 0.13% 0.40%
Feb-17 186,127,218 46,028,655 0.777% 84,036,078 1.56% 0.57% 0.38% 54,956,116 1.16% 0.26% 0.39%
Mar-17 180,720,329 40,778,655 0.821% 84,203,833 1.59% 0.27% 0.10% 55,036,202 1.17% 0.28% 0.25%
Apr-17 176,886,824 36,353,121 0.884% 84,254,557 1.58% 0.57% 0.38% 55,069,278 1.18% 0.38% 0.35%
May-17 184,129,362 43,453,119 0.925% 84,366,558 1.61% 0.95% 0.75% 55,139,856 1.21% 0.52% 0.57%
Jun-17 191,761,138 49,953,121 0.978% 84,433,672 1.63% 0.08% -0.30% 55,188,911 1.24% 0.54% 0.83%
Jul-17 186,724,734 44,548,019 1.051% 84,553,984 1.64% 0.33% 0.00% 55,200,136 1.24% 0.74% 0.89%
Aug-17 180,293,288 39,248,019 1.084% 84,648,884 1.65% 0.86% 0.61% 55,293,843 1.27% 0.79% 0.95%
Sep-17 180,597,317 37,148,019 1.111% 84,681,990 1.68% 0.52% 0.15% 55,327,685 1.38% 0.90% 1.00%
Oct-17 179,411,035 37,462,434 1.143% 84,785,780 1.68% 0.62% 0.26% 55,413,748 1.35% 1.01% 1.06%
Nov-17 175,469,499 34,062,434 1.172% 84,916,378 1.69% 1.16% 0.88% 55,471,666 1.38% 1.12% 1.13%
Dec-17 179,112,928 36,962,434 1.239% 85,008,412 1.73% 1.14% 0.86% 55,541,162 1.44% 0.82% 0.42%
Jan-18 192,795,926 49,974,332 1.350% 85,144,970 1.78% 0.47% 0.12% 55,563,293 1.48% -0.13% 0.93%
Feb-18 202,940,569 55,774,331 1.412% 85,263,827 1.80% 0.08% -0.23% 55,682,887 1.55% -0.19% -0.13%
Mar-18 195,416,305 52,074,331 1.524% 85,446,356 1.82% 0.22% 0.00% 55,785,899 1.57% -0.01% 0.03%
Apr-18 191,668,439 48,358,005 1.661% 85,541,787 1.86% -0.33% -0.62% 55,920,551 1.63% 0.00% 0.00%
May-18 210,976,889 65,058,005 1.755% 85,714,498 1.91% -0.16% -0.39% 55,998,203 1.67% 0.65% 1.65%
Jun-18 207,635,739 61,758,005 1.854% 88,337,665 1.97% -0.05% -0.28% 56,077,829 1.70% 0.36% 0.08%
Important Notes
(1) Total General Portfolio includes all assets that comprise the City's Investment Portfolio which is LAIF as well as assets managed by Chandler and Insight. (5) The portfolio benchmarks are: Chandler-Bank of America-Merrill Lynch 1 to 5 year Government Index and Insight- Bank of America-Merrill Lynch 1 to 3 year Treasury Index
(2) Yield to Maturity (YTM): The rate of return on an investment or security if it were to be held until maturity. This yield does not reflect changes in the market value of a security (6) As the result of a transition to a new reporting platform Weighted Avg Yield to Maturity and Total Return Yield data is not available from Insight.
(3) Rate of Return represents the gain or loss on an investment or portfolio of investments over a specified period, expressed as a percentage of increase over the initial
investment cost. Gains on investments are considered to be any income received from the security or portfolio plus any realized capital gain. This measure of return
recognizes the changes in market values of a security or portfolio of securities.
(4) The Rate of Return for the investment portfolio reflects the performance of the portfolio durint the past twelve months.
19