
Page 11 - 2020 Popular Annual Financial Report
P. 11
general fund change in
EXPENDITURES NET POSITION
CITY OF MORENO VALLEY NET POSITION (IN $000’S)
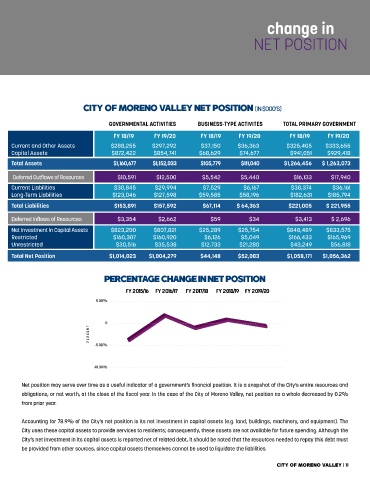
CITY OF MORENO VALLEY’S NET POSITION (in $000’s)
GOVERNMENTAL ACTIVITIES BUSINESS-TYPE ACTIVITES TOTAL PRIMARY GOVERNMENT
FY 18/19 FY 19/20 FY 18/19 FY 19/20 FY 18/19 FY 19/20
Current and Other Assets $288,255 $297,292 $37,150 $36,363 $325,405 $333,655
Capital Assets $872,422 $854,741 $68,629 $74,677 $941,051 $929,418
Total Assets $1,160,677 $1,152,033 $105,779 $111,040 $1,266,456 $ 1,263,073
Deferred Outflows of Resources $10,591 $12,500 $5,542 $5,440 $16,133 $17,940
Current Liabilities $30,845 $29,994 $7,529 $6,167 $38,374 $36,161
Long-Term Liabilities $123,046 $127,598 $59,585 $58,196 $182,631 $185,794
Total Liabilities $153,891 $157,592 $67,114 $ 64,363 $221,005 $ 221,955
Deferred Inflows of Resources $3,354 $2,662 $59 $34 $3,413 $ 2,696
Net Investment In Capital Assets $823,200 $807,821 $25,289 $25,754 $848,489 $833,575
Restricted $160,307 $160,920 $6,126 $5,049 $166,433 $165,969
Unrestricted $30,516 $35,538 $12,733 $21,280 $43,249 $56,818
Total Net Position $1,014,023 $1,004,279 $44,148 $52,083 $1,058,171 $1,056,362
PERCENTAGE CHANGE IN NET POSITION
FY 2015/16 FY 2016/17 FY 2017/18 FY 2018/19 FY 2019/20
5.00%
0
PERCENT
-5.00%
-10.00%
Net position may serve over time as a useful indicator of a government’s financial position. It is a snapshot of the City’s entire resources and
obligations, or net worth, at the close of the fiscal year. In the case of the City of Moreno Valley, net position as a whole decreased by 0.2%
from prior year.
Accounting for 78.9% of the City’s net position is its net investment in capital assets (e.g. land, buildings, machinery, and equipment). The
City uses these capital assets to provide services to residents; consequently, these assets are not available for future spending. Although the
City’s net investment in its capital assets is reported net of related debt, it should be noted that the resources needed to repay this debt must
be provided from other sources, since capital assets themselves cannot be used to liquidate the liabilities.
City of Moreno Valley | 11