Page 15 - MVU Annual Report 2019/20
P. 15

CASH FLOWS FROM CAPITAL AND RELATED FINANCING ACTIVITIES
        Acquisition and construction of capital assets                                                  ($6,458, 706)
        Proceeds from the sale or disposition of capital assets                                                    -
        Engineering plan check fees                                                                         $423,917
        Principal paid on capital debt                                                                   ($1,230,135)
        Interest paid on capital debt                                                                    ($2,920,470)
        Net cash provided (used) by capital and related financing activities                            ($10,185,394)
        CASH FLOWS FROM INVESTING ACTIVITIES
        Interest received                                                                                   $810,852
        Net cash provided (used) by investing activities                                                    $810,852
        Net increase (decrease) in cash and cash equivalents                                              ($1,553,714)
        Balances - beginning of year                                                                     $32,856,783
        Balances - end of the year                                                                      $31,303 ,069
        Reconciliation of operating income to net cash provided (used) by operating activities:
        Operating Income                                                                                   7,999,528
        Adjustments to reconcile operating income (loss) to net cash provided (used)
        by operating activities:
        Depreciation                                                                                        2,115,577
        Amortization                                                                                          177,477
        Changes in assets and liabilities:
          (Increase) decrease in customer receivables                                                       (760,142)
          (Increase) decrease in prepaid costs                                                               (13,670)
          (Increase) decrease in deferred outflows related to pension                                       (22,626)
          (Increase) decrease in deferred outflows related to OPEB                                           (53,599)
          (Increase) decrease in deferred outflows -utility network                                                -
          (Increase) decrease in inventories                                                                  (7,390)
          Increase (decrease) in accounts payable                                                         (1,792,025)
          Increase (decrease) in unearned revenue                                                             (7,305)
          Increase (decrease) in deposits payable                                                             69,987
          Increase (decrease) in self-insurance payable                                                            -
          Increase (decrease) in net pension liability                                                       165,812
          Increase (decrease) in OPEB Liability                                                               56,578
          Increase (decrease) in deferred inflows related to pension                                         (23,678)
          Increase (decrease) in deferred inflows related to OPEB                                             (1,006)
          Increase (decrease) in compensated absences                                                         49,990
        Net cash provided (used) by operating activities                                                 $7,968 ,288

        Noncash capital and related financing activities:
        Contributed capital - donated infrastructure                                                      $1,704,623
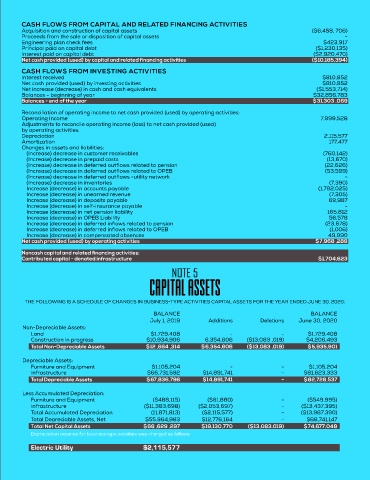
                                                          NOTE 5
                                                  Capital Assets


         THE FOLLOWING IS A SCHEDULE OF CHANGES IN BUSINESS¨TYPE ACTIVITIES CAPITAL ASSETS FOR THE YEAR ENDED JUNE 30, 2020:
                                                    BALANCE                                             BALANCE
                                                   July 1, 2019       Additions        Deletions    June 30, 2020
        Non-Depreciable Assets:
           Land                                    $1,729,408                -                -        $1,729,408
           Construction in progress              $10,934,906         6,354,606     ($13,083 ,019)     $4,206,493
           Total Non-Depreciable Assets          $12 ,664 ,314      $6,354,606     ($13,083 ,019)      $5,935,901

        Depreciable Assets:
           Furniture and Equipment                 $1,105,204                -                -        $1,105,204
           Infrastructure                         $66,731,592       $14,891,741               -       $81,623,333
           Total Depreciable Assets              $67,836,796        $14,891,741               -      $82,728,537
        Less Accumulated Depreciation:
           Furniture and Equipment                  ($488,115)        ($61,880)               -        ($549,995)
           Infrastructure                        ($11,383,698)     ($2,053,697)               -      ($13,437,395)
           Total Accumulated Depreciation          (11,871,813)     ($2,115,577)              -      ($13,987,390)
           Total Depreciable Assets, Net         $55,964,983        $12,776,164               -       $68,741,147
           Total Net Capital Assets             $68 ,629 ,297       $19,130,770    ($13,083.019)     $74,677,048
           Depreciation expense for business-type activities was charged as follows:
           Electric Utility                     $2,115,577
   10   11   12   13   14   15   16