Page 29 - MVU Annual Report 2017/18
P. 29

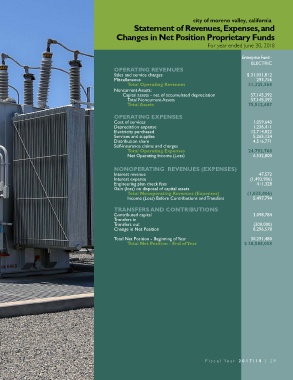
city of moreno valley, california
                                                         Statement of Revenues, Expenses, and
                                                  Changes in Net Position Proprietary Funds

                                                                                        For year ended June 30, 2018

                                                                                                      Enterprise Fund -
                                                                                                          ELECTRIC
                                                 OPERATING REVENUES
                                                 Sales and service charges                              $ 31,031,812
                                                 Miscellaneous                                               293,756
                                                      Total Operating Revenues                           31,325,568
                                                 Noncurrent Assets:
                                                    Capital assets - net of accumulated depreciation      57,145,392
                                                      Total Noncurrent Assets                             57,145,392
                                                      Total Assets                                       75,512,687

                                                 OPERATING EXPENSES
                                                 Cost of services                                          1,059,640
                                                 Depreciation expense                                      1,236,411
                                                 Electricity purchased                                    12,714,822
                                                 Services and supplies                                     5,265,124
                                                 Distribution share                                        4,516,771
                                                 Self-insurance claims and charges
                                                      Total Operating Expenses                           24,792,768
                                                      Net Operating Income (Loss)                          6,532,800

                                                 NONOPERATING  REVENUES (EXPENSES)
                                                 Interest revenue                                            47,572
                                                 Interest expense                                        (1,493,906)
                                                 Engineering plan check fees                                411,328
                                                 Gain (loss) on disposal of capital assets
                                                      Total Nonoperating Revenues (Expenses)            (1,035,006)
                                                      Income (Loss) Before Contributions and Transfers     5,497,794

                                                 TRANSFERS AND CONTRIBUTIONS
                                                 Contributed capital                                       3,098,784
                                                 Transfers in
                                                 Transfers out                                             (300,000)
                                                 Change in Net Position                                    8,296,578

                                                 Total Net Position - Beginning of Year                   30,291,480
                                                      Total Net Position - End of Year                 $ 38,588,058


                                                                                       Fiscal Y ear  2017/18   |  29
   24   25   26   27   28   29   30   31   32