
Page 13 - Moreno Valley City Manager's Report for 2022
P. 13
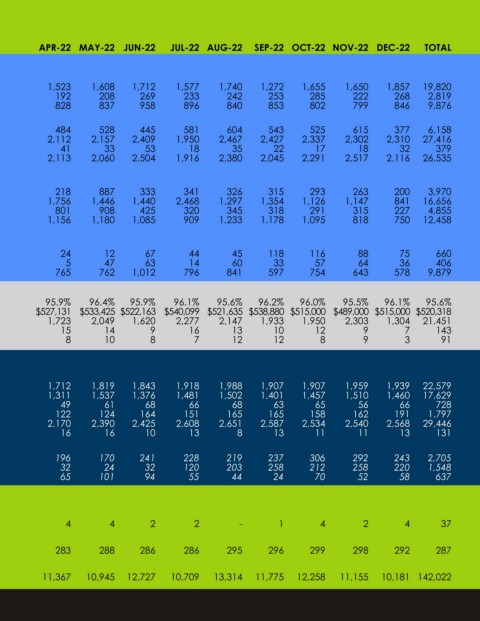
STATISTICS TRACKED MONTHLY
    JAN-22   FEB-22  MAR-22   APR-22  MAY-22  JUN-22   JUL-22  AUG-22  SEP-22  OCT-22  NOV-22  DEC-22        TOTAL
 COMMUNITYDEVELOPMENT
 ANIMAL SERVICES
 # of Animal Shelter Visits     1,836     1,665     1,725     1,523     1,608     1,712     1,577     1,740     1,272     1,655     1,650     1,857    19,820
 # of Positive Outcomes for Sheltered Animals       209     221     217     192     208     269     233     242     253     285     222     268     2,819
 # of Responded Animal Services Field Service Calls       738     597     882     828     837     958     896     840     853     802     799     846     9,876
 BUILDING
 # of Building Permits Issued       506     377     573     484     528     445     581     604     543     525     615     377     6,158
 # of Building & Safety Construction Inspections      2,144     2,239     2,562     2,112     2,157     2,409     1,950     2,467     2,427     2,337     2,302     2,310    27,416
 # of Building & Safety Occupancy Approvals Issued       31     39     40     41     33     53     18     35     22     17     18     32     379
 # of Building and Safety Phone Calls       2,057     2,073     2,463     2,113     2,060     2,504     1,916     2,380     2,045     2,291     2,517     2,116    26,535
 and Counter Customers Assisted
 CODE
 # of Code & Neighborhood Services Cases Initiated      219     190     385     218     887     333     341     326     315     293     263     200     3,970
 # of Code & Neighborhood Services Inspections Conducted     1,096     1,056     1,629     1,756     1,446     1,440     2,468     1,297     1,354     1,126     1,147     841    16,656
 # of Code & Neighborhood Cases Resolved     326     263     316     801     908     425     320     345     318     291     315     227     4,855
 # of Code & Neighborhood Phone Calls      894     944     1,216     1,156     1,180     1,085     909     1,233     1,178     1,095     818     750    12,458
   and Counter Customers Assisted
 PLANNING
 # of New Planning Project Applications Processed     24     19     28     24     12     67     44     45     118     116     88     75     660
 # of Approved Planning Project Applications     11     6     10     5     47     63     14     60     33     57     64     36     406
 # of Planning Phone Calls and Counter Customers Assisted      907     955     1,269     765     762     1,012     796     841     597     754     643     578     9,879

 ECONOMICDEVELOPMENT
 Employment Numbers      93.6%   94.5%   95.4%   95.9%   96.4%   95.9%   96.1%   95.6%   96.2%   96.0%   95.5%   96.1%   95.6%
 Housing Market Resale Value      $513,835   $507,347   $520,304     $527,131    $533,425   $522,163    $540,099   $521,635   $538,880   $515,000   $489,000   $515,000   $520,318
 Business & Employment Resource Center Customers Served       1,313     1,303     1,529     1,723     2,049     1,620     2,277     2,147     1,933     1,950     2,303     1,304    21,451
 # of Training Workshops Held       11     14     13     15     14     9     16     13     10     12     9     7     143
 # of Small Business Workshops Held       8     3     3     8     10     8     7     12     12     8     9     3     91

 FIREDEPARTMENT

 OPERATIONS
 # of Calls for Services     1,996     1,770     1,821     1,712     1,819     1,843     1,918     1,988     1,907     1,907     1,959     1,939    22,579
 Total Emergency Medical Calls (EMS)      1,733     1,489     1,372     1,311     1,537     1,376     1,481     1,502     1,401     1,457     1,510     1,460    17,629
 # of Fire Calls (Commercial, Multi-Family, Other, Residential)     38     60     68     49     61     68     66     68     63     65     56     66     728
 # of False Alarm Responses     134     130     131     122     124     164     151     165     165     158     162     191     1,797
  Average # of Responses per Units      2,420     2,336     2,217     2,170     2,390     2,425     2,608     2,651     2,587     2,534     2,540     2,568    29,446
 # of Public Education Tours     1     9     10     16     16     10     13     8     13     11     11     13     131
 PREVENTION
 # of Fire & Life Safety Plan Checks Completed     170     166     237     196     170     241     228     219     237     306     292     243     2,705
 Annual Business Inspections (Initial & Reinspections)     117     57     15     32     24     32     120     203     258     212     258     220     1,548
 Apartment Inspections (Initial & Reinspections)       26     42     6     65     101     94     55     44     24     70     52     58     637

 FINANCIAL&MANAGEMENTSERVICES

 PURCHASING
 # of RFP/RFQ/ Bids     4     5     5     4     4     2     2     -       1        4          2          4        37
 HUMAN RESOURCES
 Total # of Career City Employees      271     273     272     283     288     286     286     295     296     299     298     292     287
  TECHNOLOGY SERVICES
 # of Incoming Phone Calls      12,755    11,537    13,299     11,367    10,945    12,727    10,709    13,314    11,775    12,258    11,155    10,181   142,022